Quick version
A long-term ECG is an important test for analyzing the heart's rhythm over time and is often used for symptoms such as palpitations, irregular heartbeat, dizziness or suspected rhythm disturbances. Unlike a regular ECG, the heart's activity is recorded continuously for one or more days, which makes it possible to detect temporary deviations that might otherwise be missed.
The test provides a detailed picture of the heart's function in everyday life, including pulse variation, extra beats and possible episodes of fast or slow heart rhythm. In most cases, the result shows a normal sinus rhythm with natural variations, which is often a reassuring message.
At the Test Clinic, your long-term ECG is analyzed by a cardiologist, and you receive a clear medical assessment of the result. This means that you not only get access to data - but also a concrete interpretation and guidance on whether further investigation is needed or not.
A long-term ECG is one of the most accurate examinations for investigating palpitations, irregular heartbeats and suspected rhythm disorders. Unlike a regular ECG, which records the heart's activity for a few seconds, a long-term ECG continuously monitors the heart's rhythm for one or more days.
This allows you to detect temporary deviations that are otherwise easily missed – especially those that occur during sleep, stress or physical activity. In most cases, the examination shows normal variations, but sometimes it can provide important information about underlying heart rhythm disorders.
What does a long-term ECG show?
The examination focuses on the heart's rhythm, pulse and any deviations over time. In most people, the recording is dominated by sinus rhythm, which is the heart's normal rhythm. The ECG also analyzes how the pulse varies between day and night, the occurrence of extra beats and any episodes of fast or slow heart rhythm.
Common findings on long-term ECG
1. Normal sinus rhythm
The most common finding is a normal heart rhythm with natural variations in heart rate depending on activity and rest.
- Lower heart rate during sleep.
- Higher heart rate during activity.
- Stable basic rhythm.
2. Extra beats (SVES and VES)
Extra beats are very common and mean that the heart beats an extra beat outside the normal rhythm.
- Feeling that the heart is "jumping".
- Common even in healthy people.
- Most often completely harmless at low frequency.
3. Fast rhythms (tachycardia)
In some cases, episodes of fast pulse can be recorded, such as supraventricular tachycardia or atrial fibrillation.
- Suddenly increased pulse.
- Can be experienced as palpitations.
- Sometimes needs further investigation.
4. Slow heart rate and pauses
During sleep, it is normal for the heart rate to drop and for shorter pauses to occur.
- Low heart rate at night.
- Shorter pauses in the heart rhythm.
- Often linked to recovery.
5. AV block and other transient rhythm phenomena
In some cases, temporary disturbances in signal transmission in the heart are seen, especially during rest.
- Common during sleep.
- Most often benign.
- Assessed in relation to symptoms.
What does the report look like after a long-term ECG?
After the examination, the recording is analyzed and compiled into a medical report. It contains both detailed data and a clear medical assessment.< /p>
The report shows, among other things, heart rate, rhythm, extra beats and any deviations over time.
Example of what the ECG report contains
Heart rate variability (HRV)
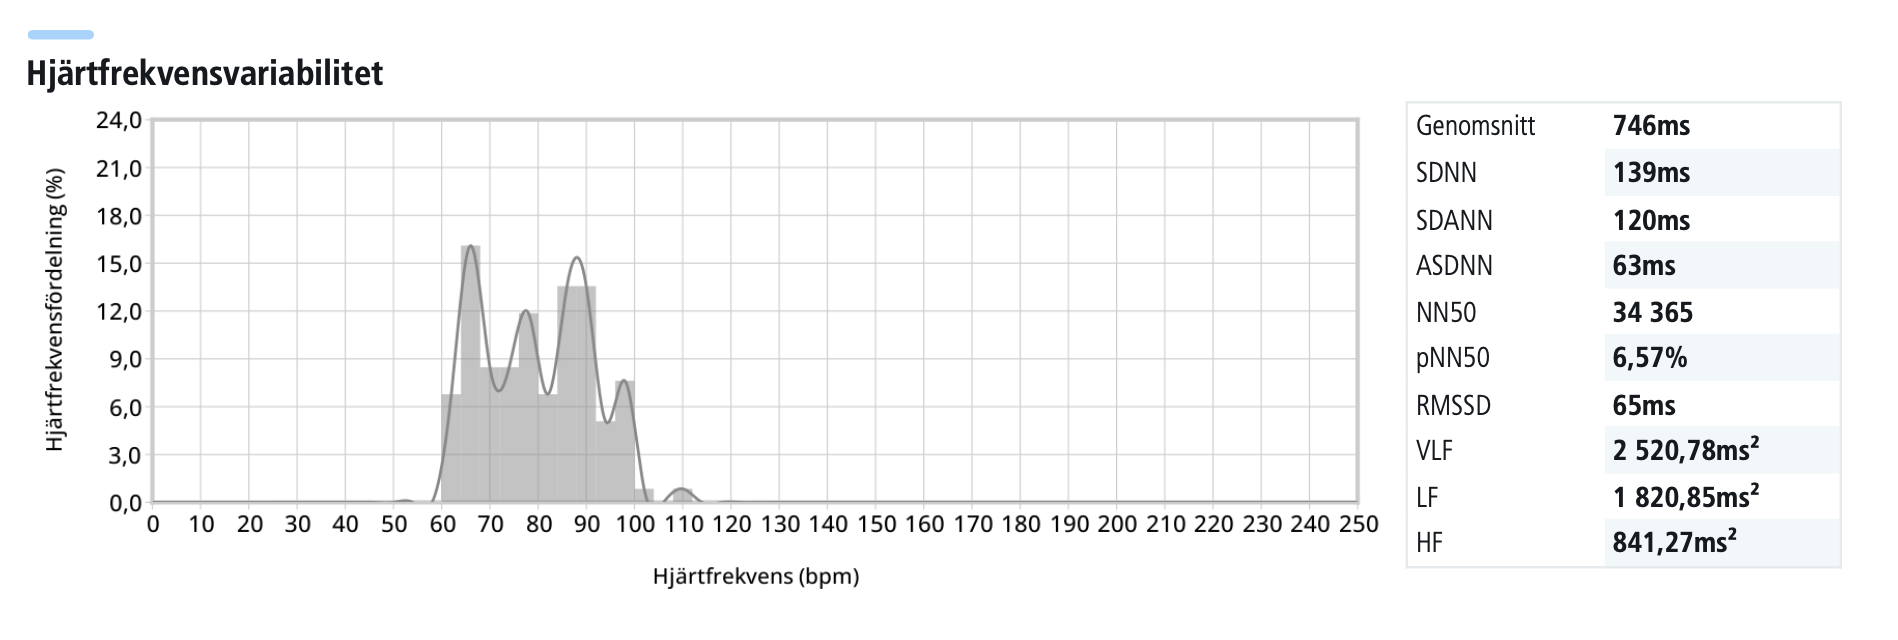
This graph shows heart rate variability (HRV), which refers to the variation in the time intervals between consecutive heartbeats (RR interval). HRV is an established marker of autonomic nervous system function, where high variability generally reflects good parasympathetic (vagal) activity and physiological recovery capacity, while low variability may be associated with stress, illness or increased sympathetic influence. The analysis can contribute to a comprehensive assessment of cardiovascular load and autonomic balance.
Burden of ventricular extra beats (VES)
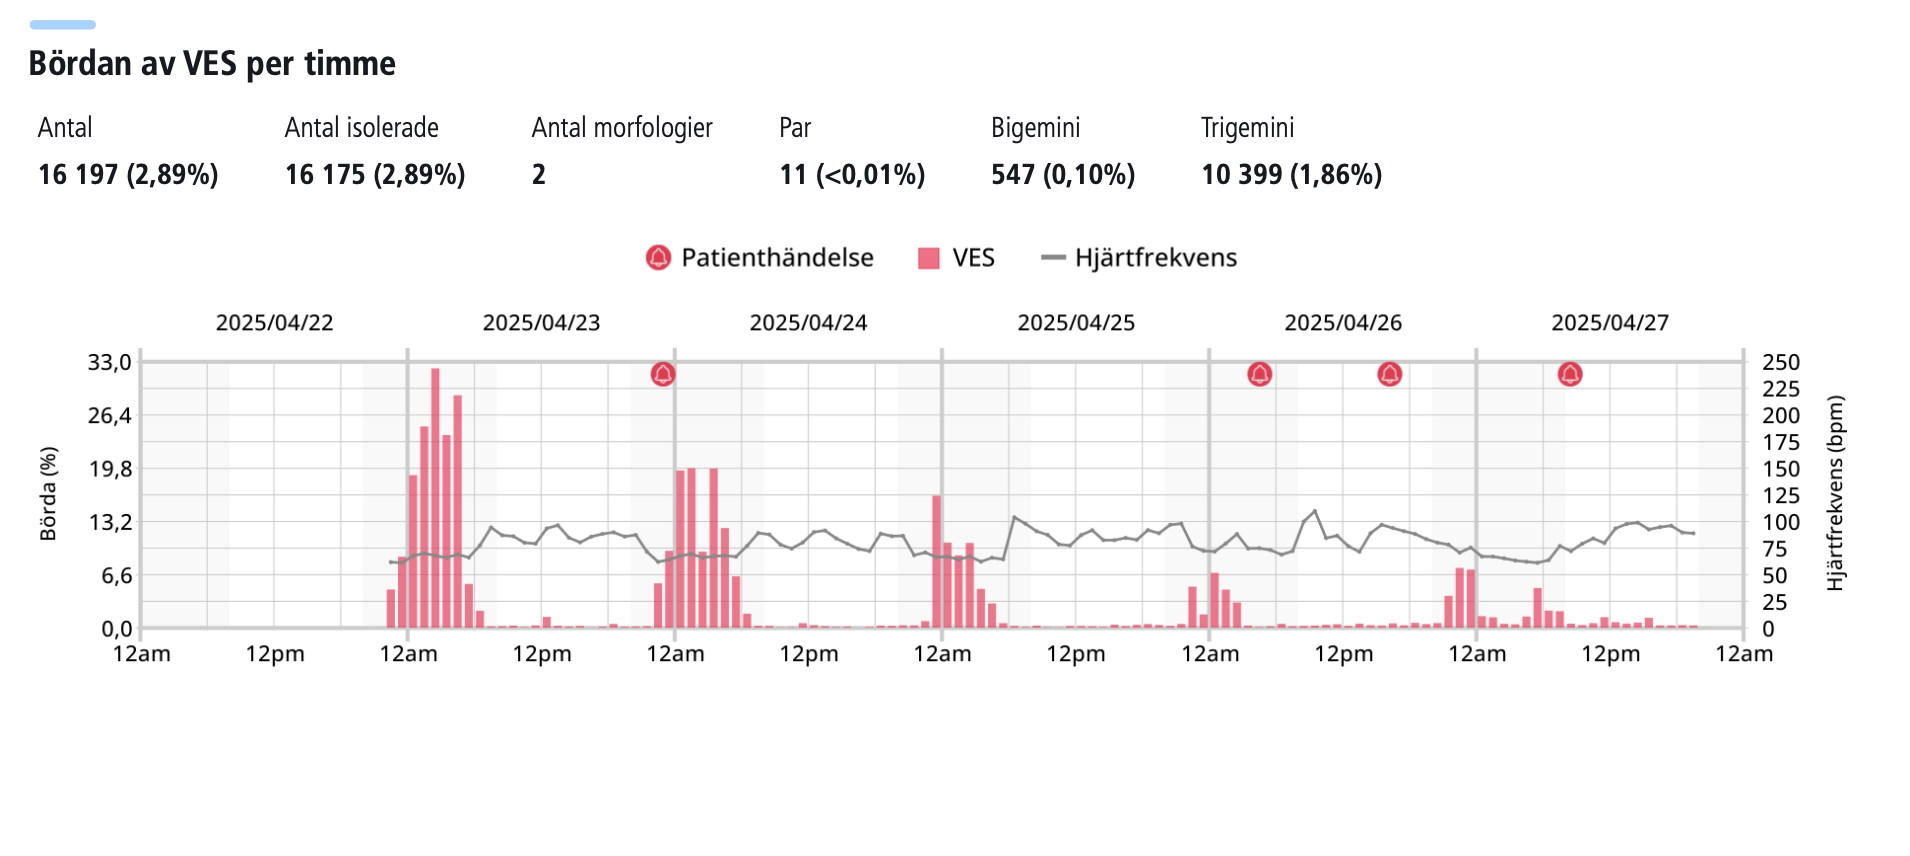
Here is shown the frequency of ventricular extra beats (VES), i.e. premature depolarizations that originate from the ventricles of the heart. These beats occur outside the normal conduction pathway and can occur in isolation, in pairs or as short bursts. Single VES are common even in healthy individuals, but an increased incidence, especially in combination with symptoms or structural heart disease, may justify further cardiological investigation. The analysis often includes both total burden and distribution over time.
The burden of supraventricular extrasystoles (SVES)
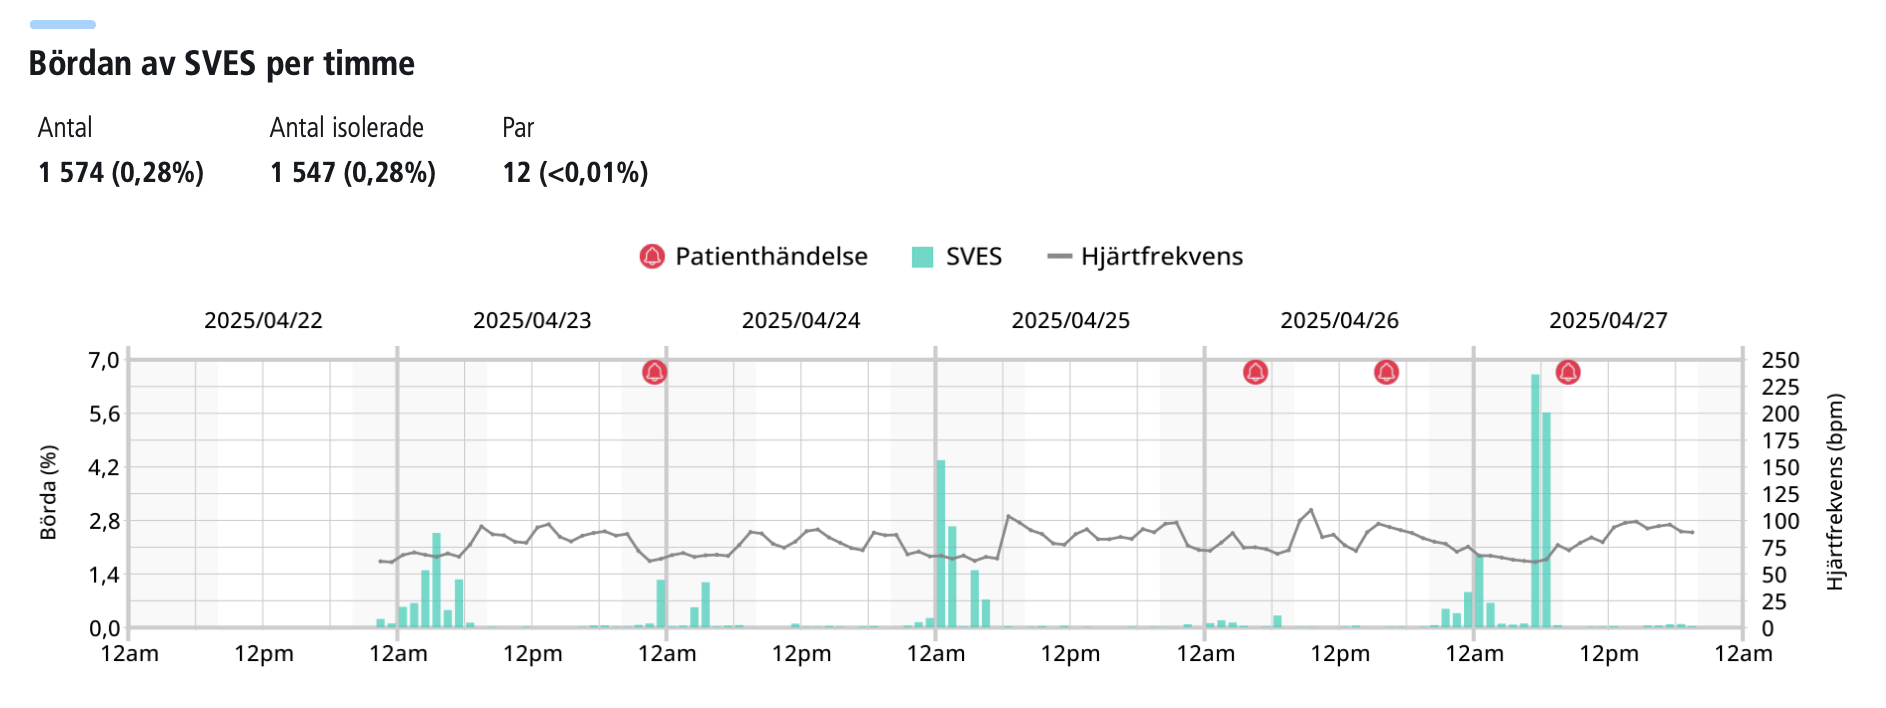
This graph shows the incidence of supraventricular extrasystoles (SVES), which originate in the atria or AV node. SVES is very common and is seen in a large proportion of the population, often without clinical significance. In some cases, however, a high frequency of SVES may be associated with an increased risk of atrial arrhythmias, such as atrial fibrillation. The analysis can therefore contribute to risk stratification and assessment of arrhythmia susceptibility.
Heart rate trend
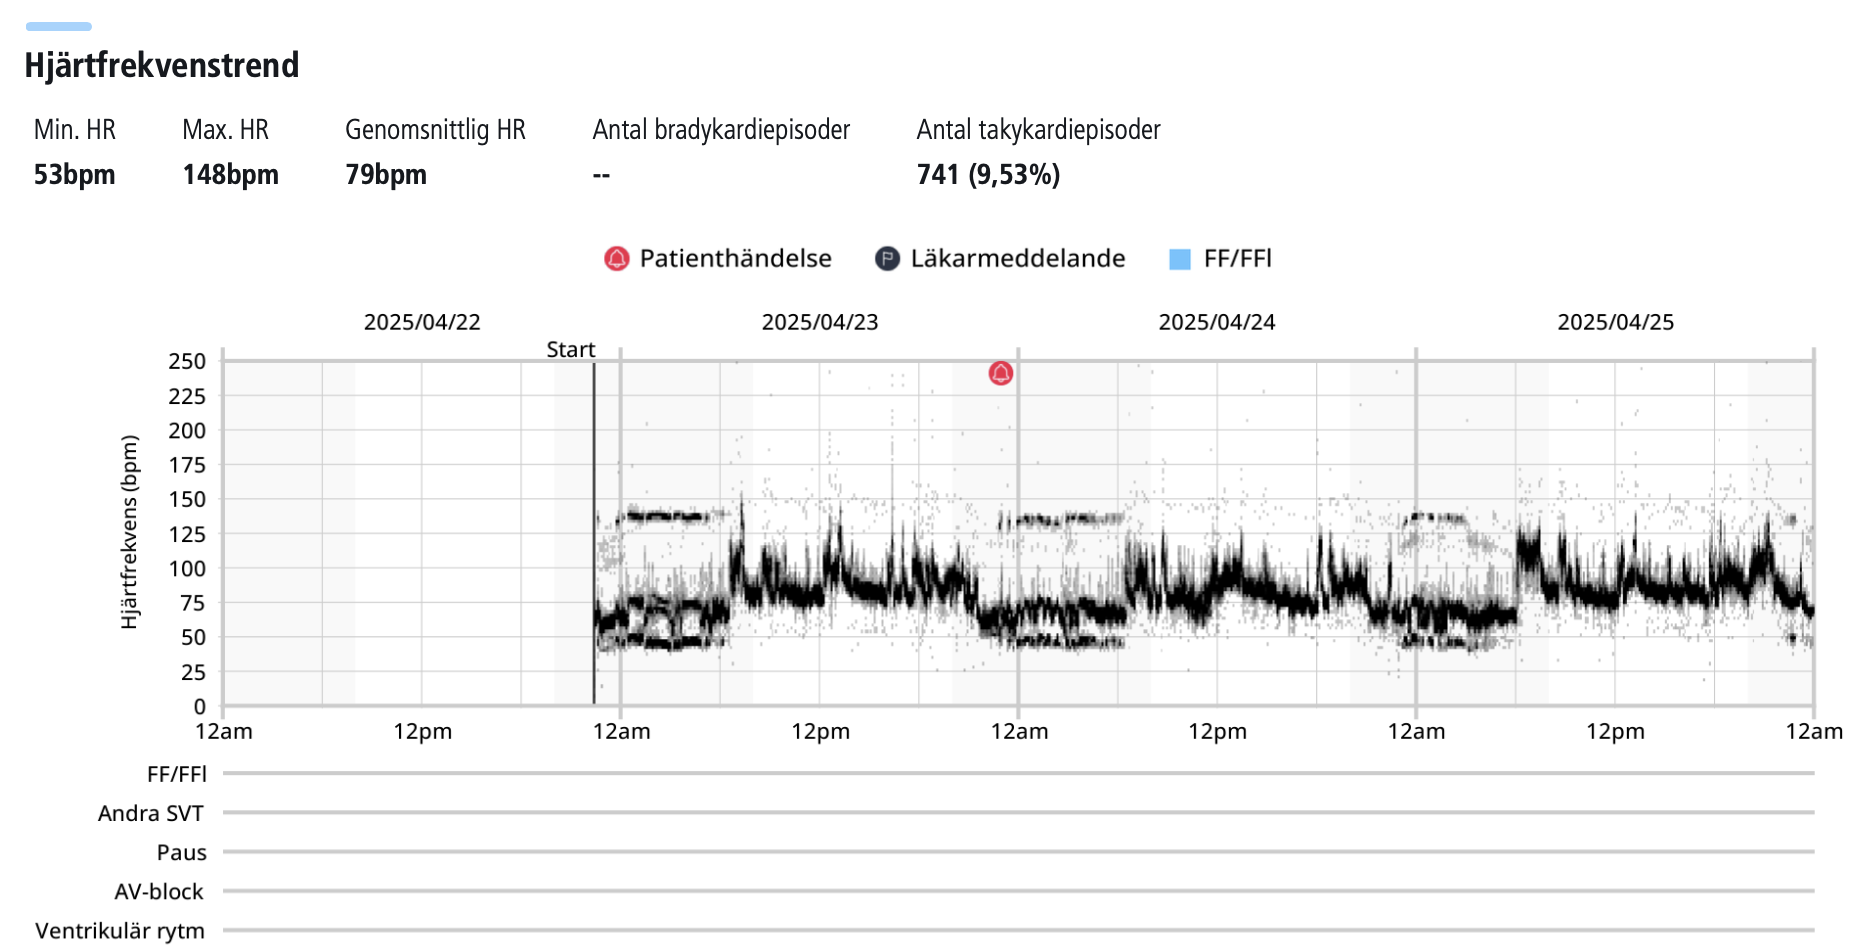
The graph shows the variation in heart rate over the entire recording period and provides a dynamic picture of the heart's rate regulation in different physiological states, such as rest, activity and sleep. This trend can be used to identify episodes of tachycardia (rapid heart rate), bradycardia (slow heart rate) or inadequate rate response, which may have diagnostic significance.
Patient events
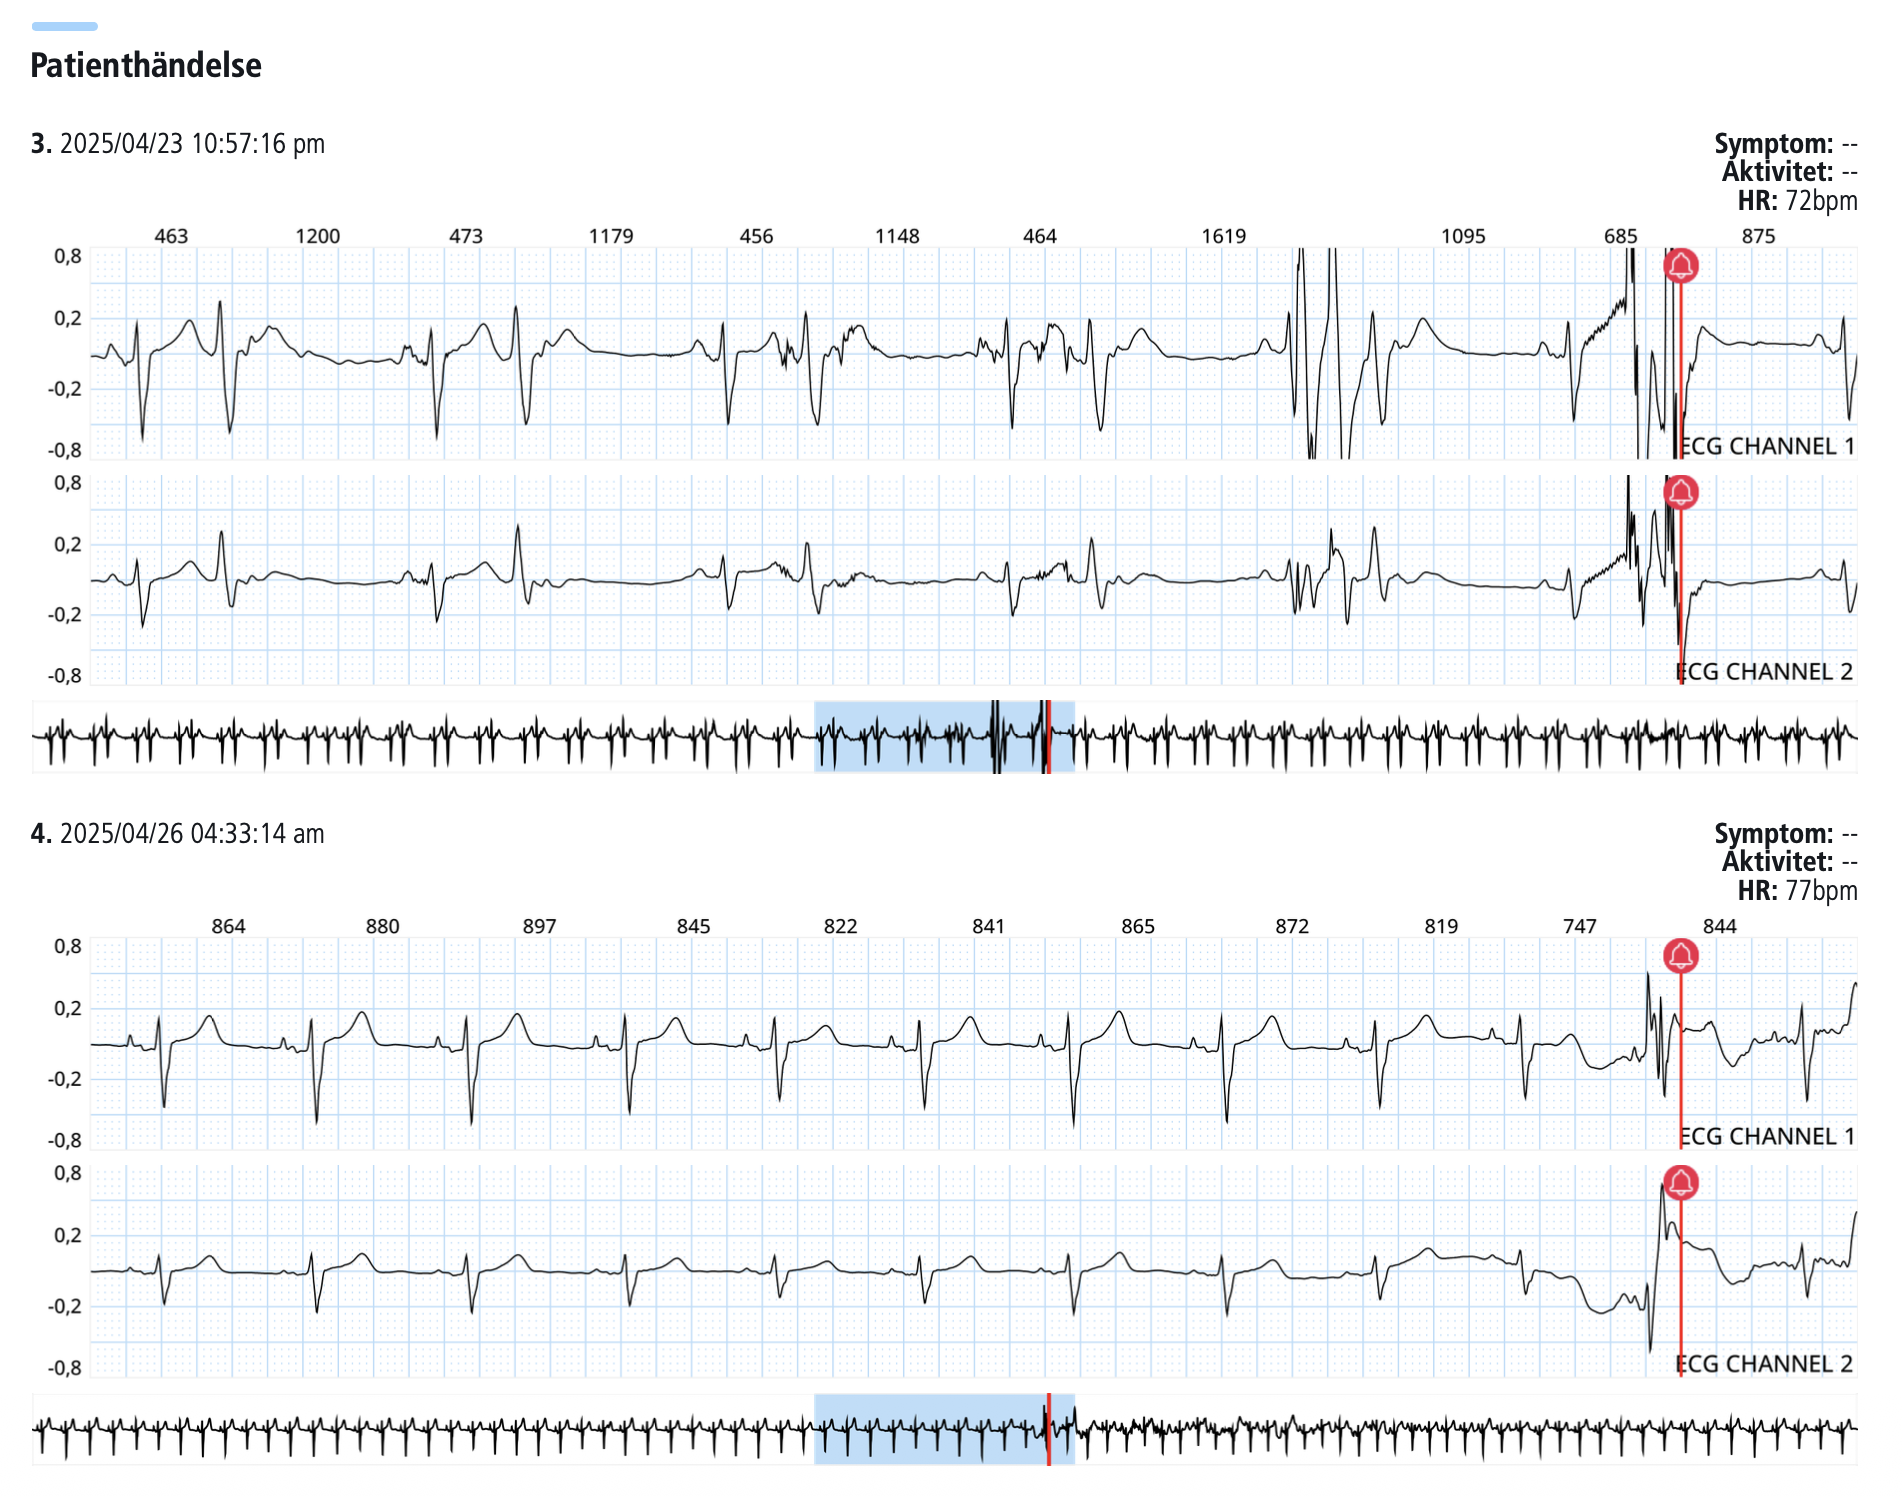
Specific events are presented here in relation to patient-reported symptoms such as palpitations, dizziness or chest discomfort. These segments enable correlation between subjective symptoms and objective arrhythmias or rhythm changes, which is central in the diagnosis of intermittent rhythm disorders. When using ECG ePatach, you as a patient can report discomfort or symptoms by clicking on the ECG, which in turn records an event.
When is a long-term ECG relevant?
Long-term ECG (Holter ECG or event recorder) is recommended when intermittent arrhythmias are suspected that are not captured by a standard ECG. Common indications include palpitations, irregular pulse, dizziness, presyncope or syncope, and follow-up of known rhythm disorders. The examination can also be used to evaluate the effect of treatment, for example in antiarrhythmic therapy or after insertion of a pacemaker.
- Palpitation.
- Irregular pulse.
- Dizziness or fainting.
- Suspected atrial fibrillation.
This is how it works with us
At the Test Clinic, you will receive a complete investigation from start to finish that lasts up to 5 days. You will also receive a clear medical interpretation of your results from a cardiologist.